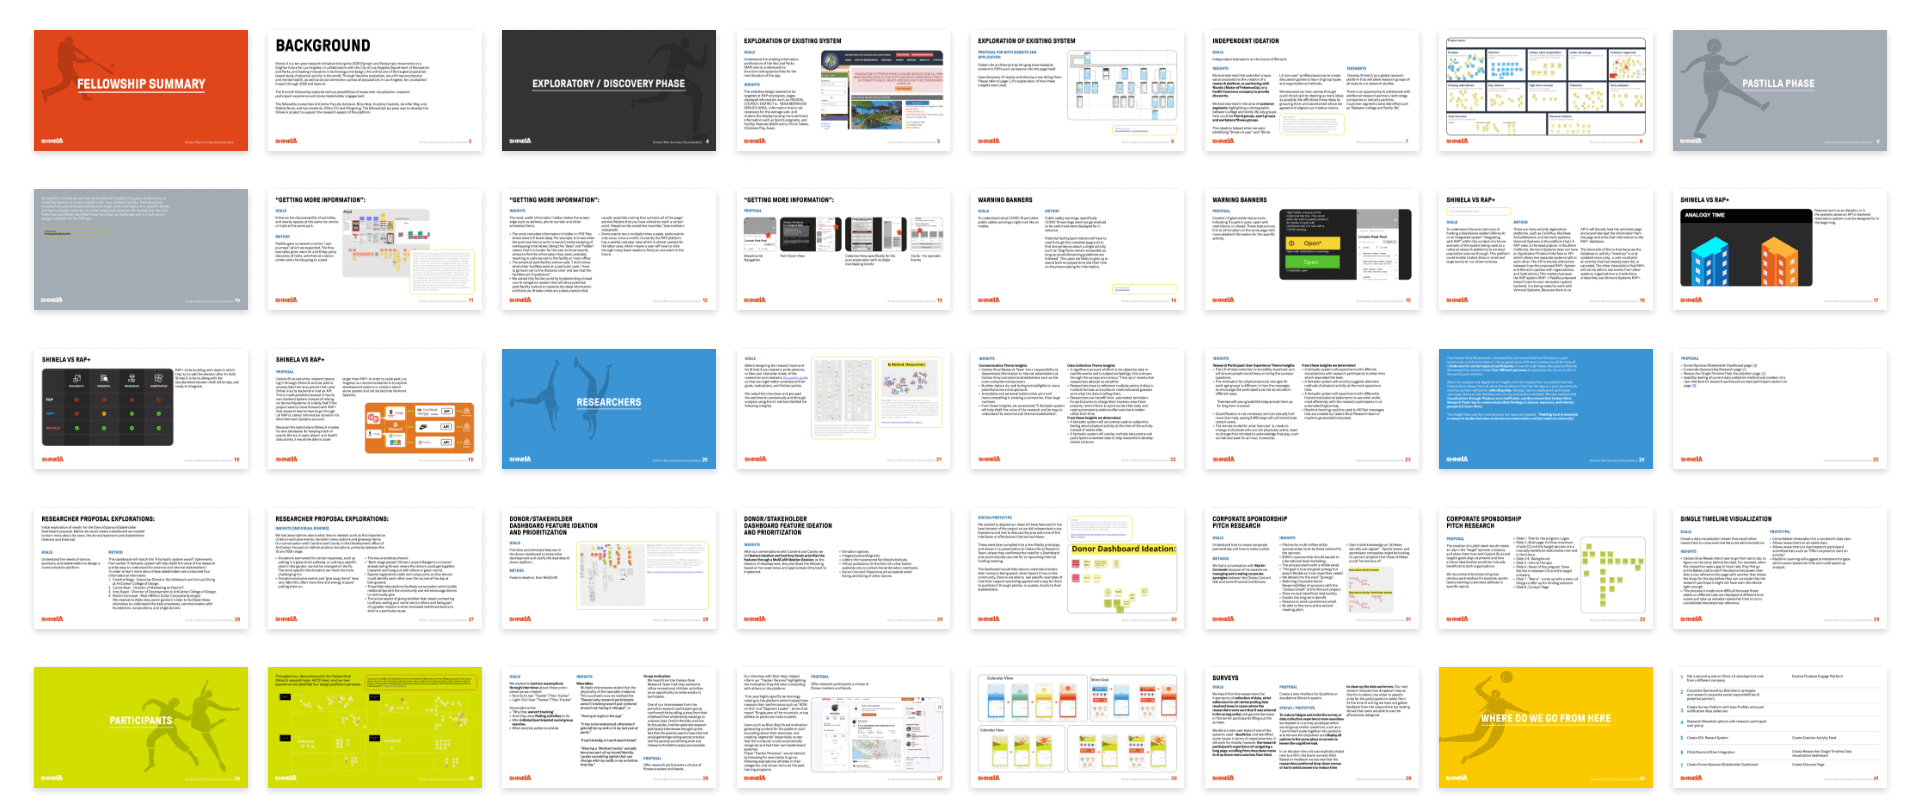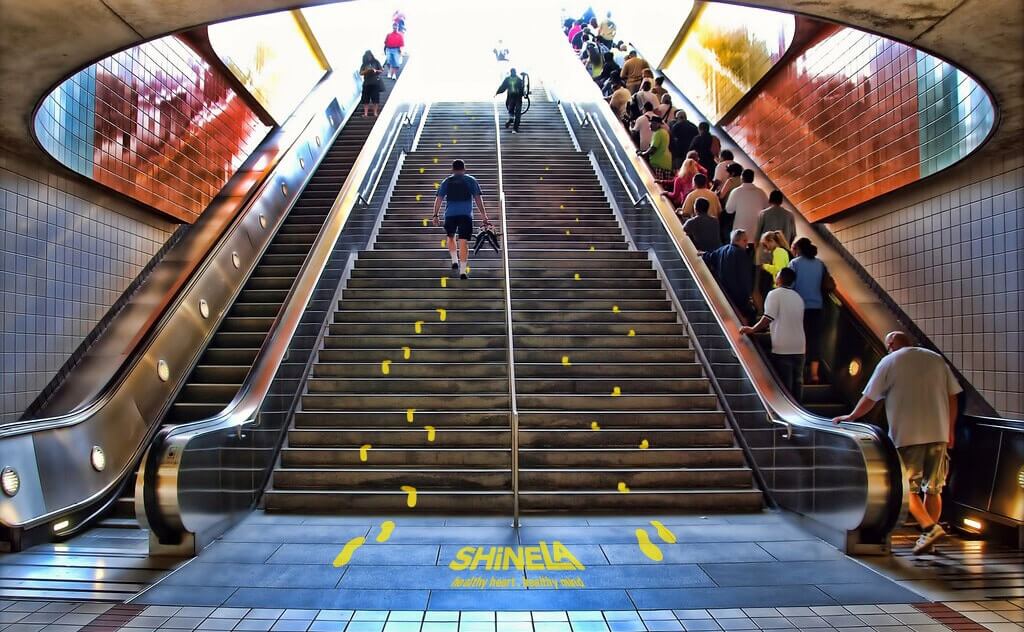
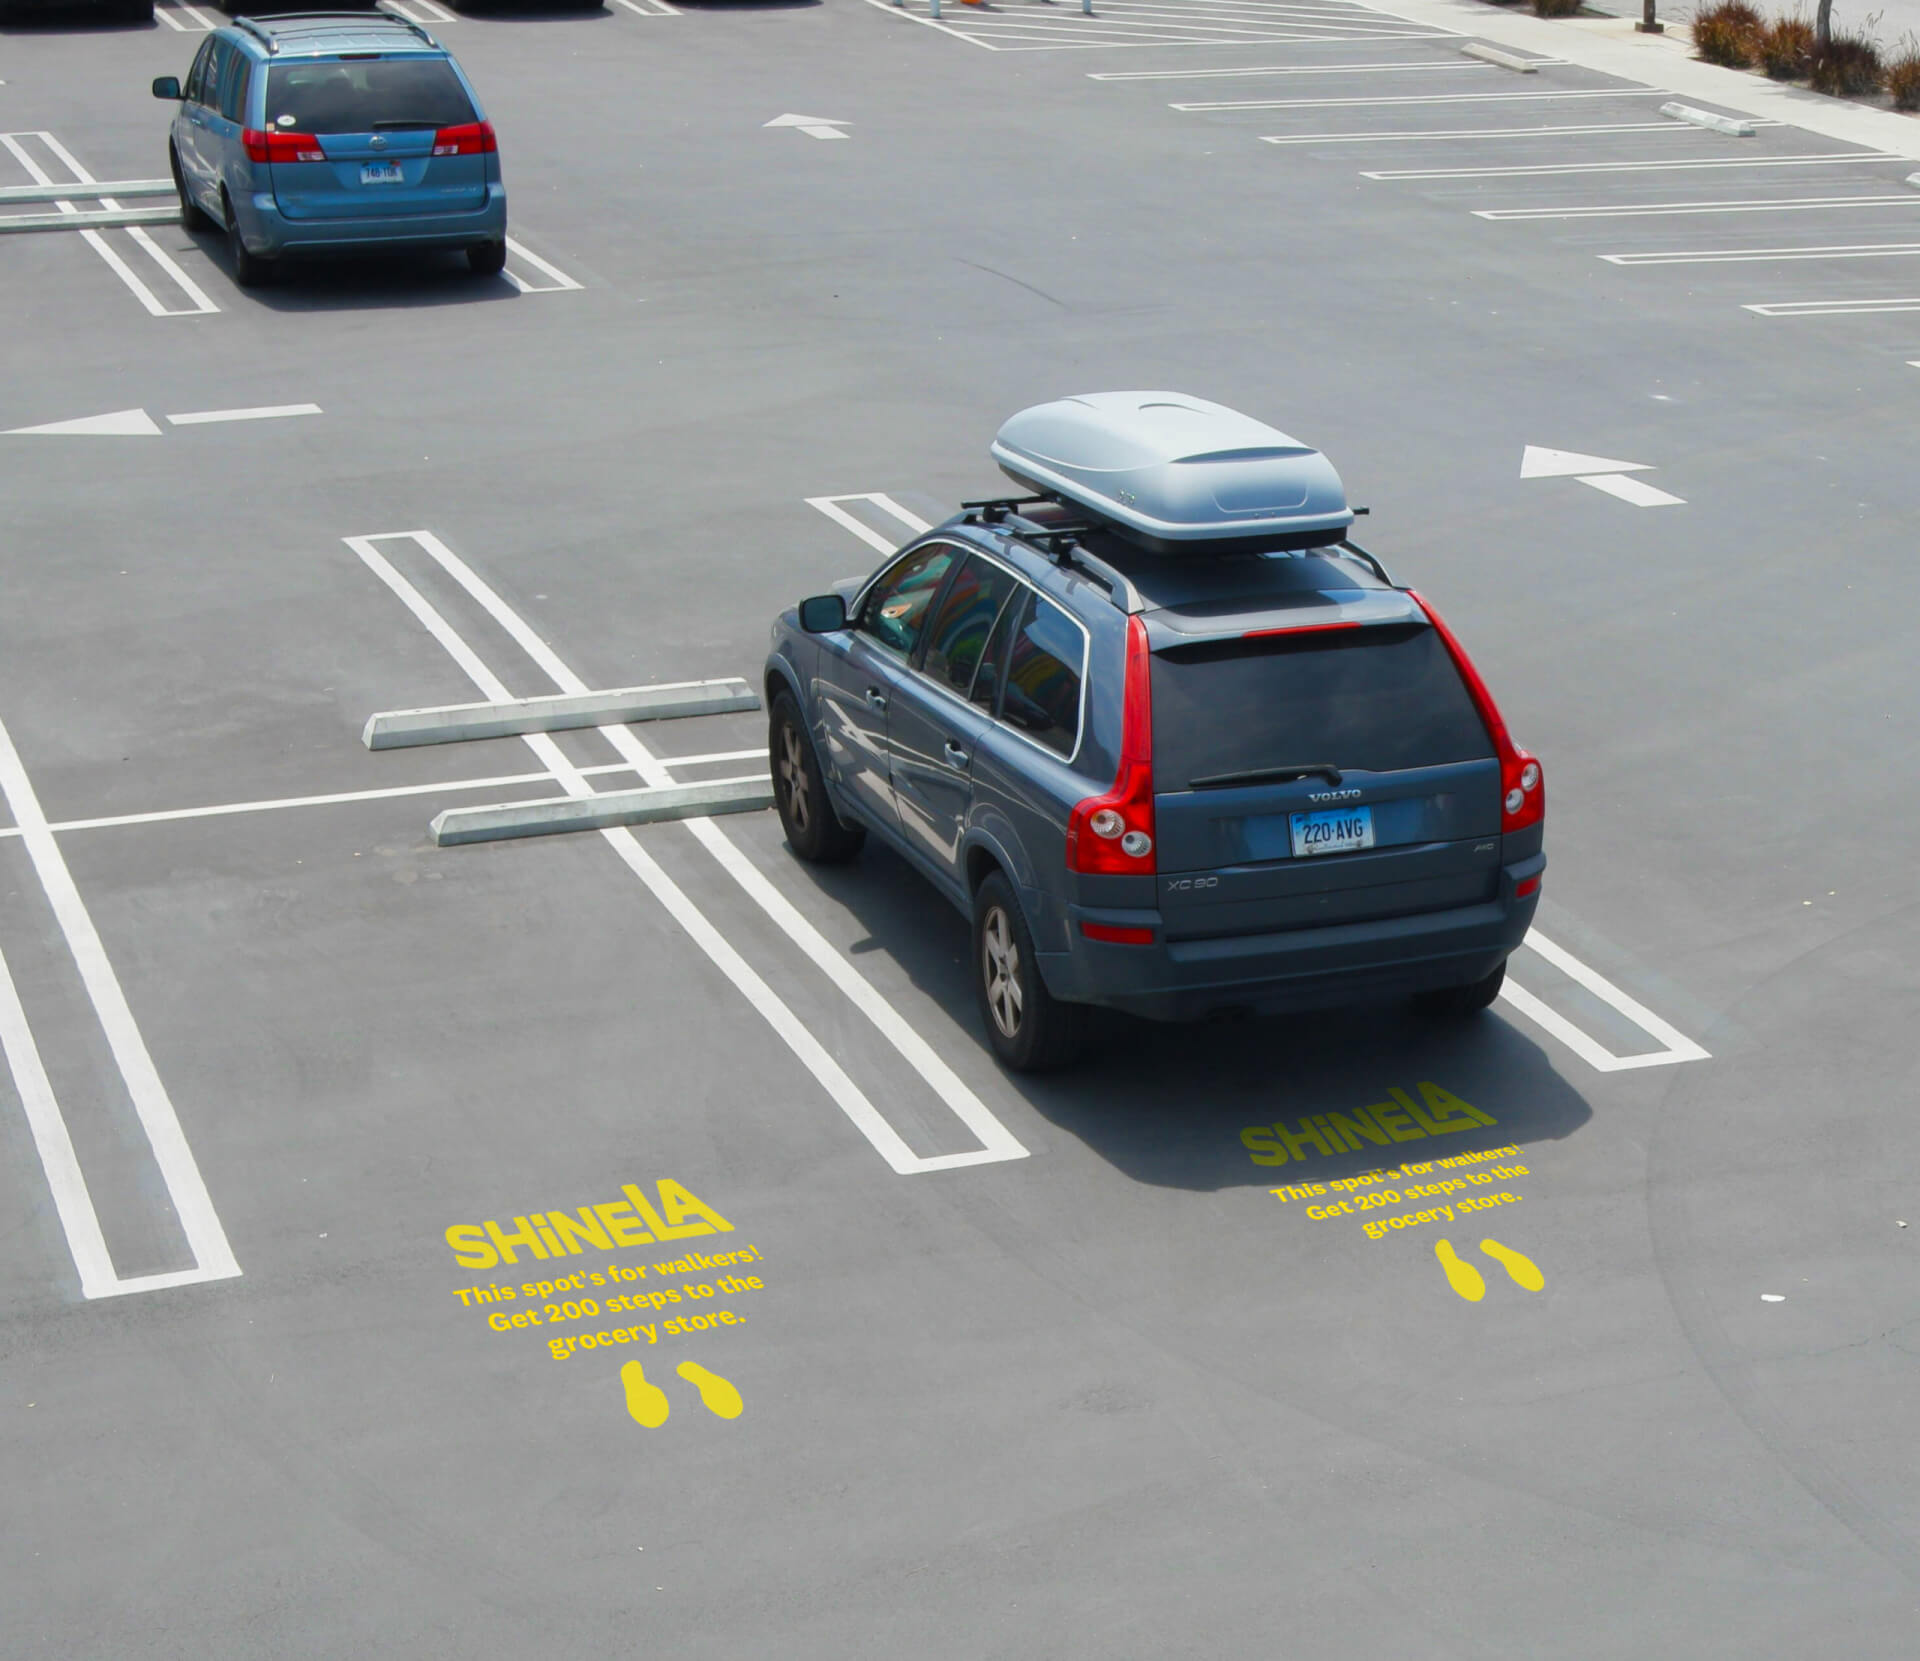
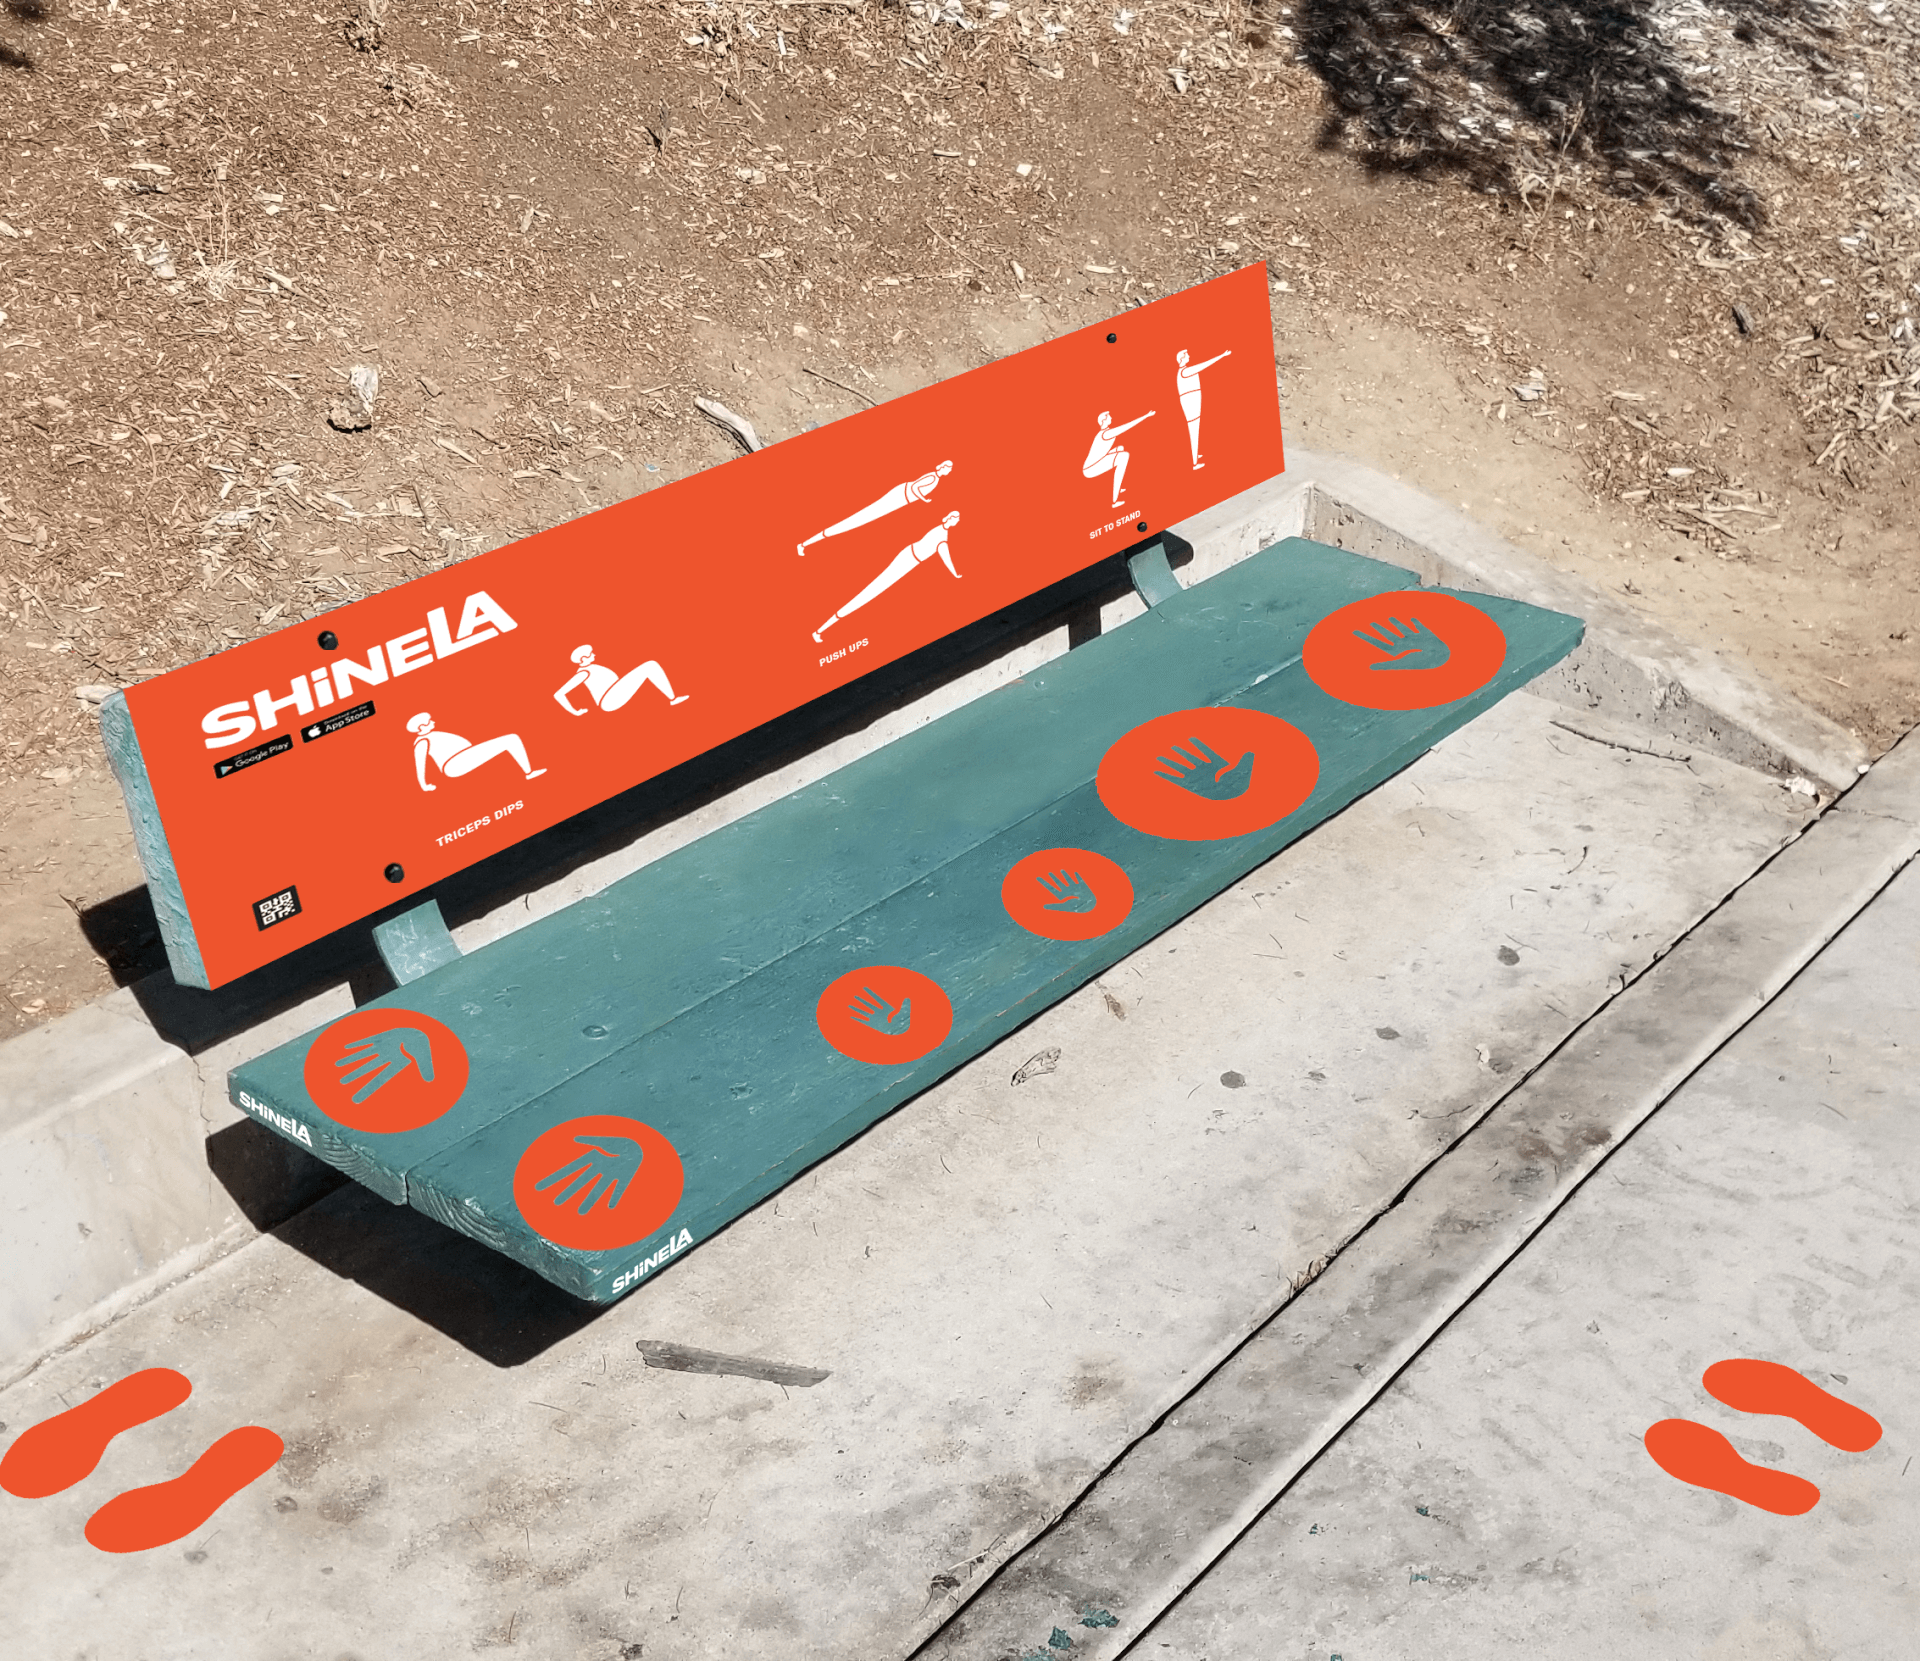
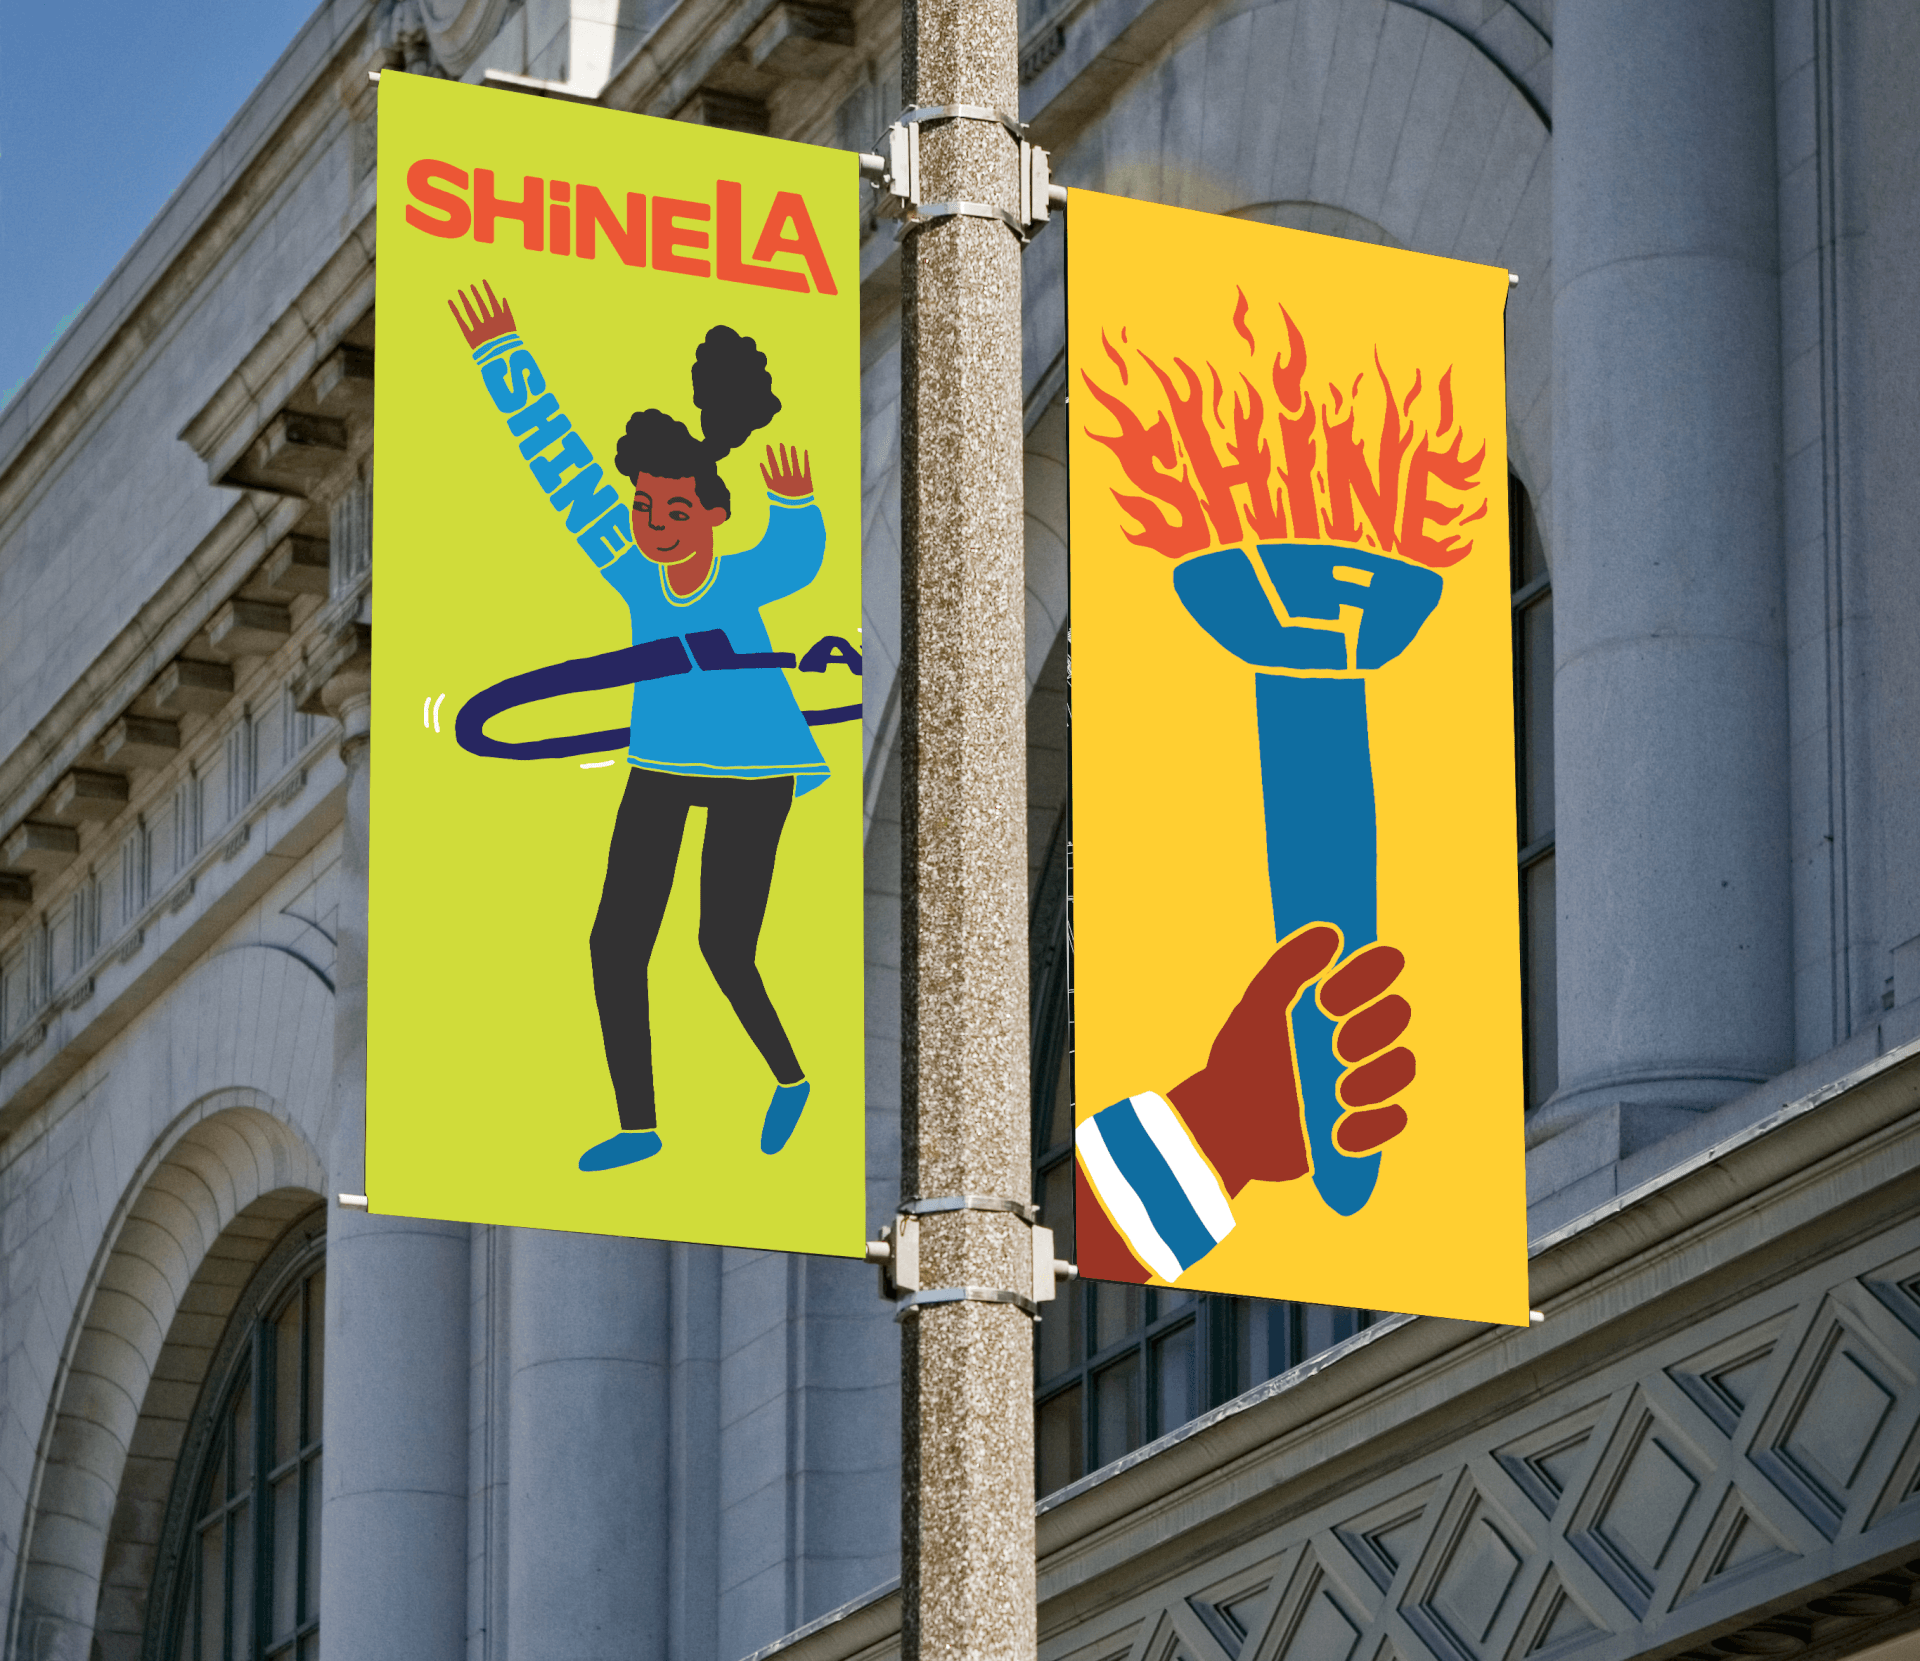
In previous collaborations between Cedars-Sinai and ArtCenter, teams created campaigns and systems to "activate" Los Angelinos.
To continue this work, we broke ground by exploring the research aspect of ShineLA as a platform for surveys, data visualization, and motivation.
ShineLA
Research to support the development of a fitness/research platform to conduct population science in Los Angeles in collaboration with Cedars-Sinai.
#PopulationHealth #SocialGood
Core Team
Dillon Chi (UX), MingMing (UI), Krystina Castella (Advisor), Brian Boyle (Advisor)
My Role
User Research, Human-Centered Design, Visual Design, Interviews, Wireframing
Timeframe
9 months (Jul 2020 - Mar 2021)
Terms
- Active Activities - Events requiring registration either online or in-person at the office
- Passive Activities - Events that require no pre-signup and allow participants to simply "walk-on"
- LA RAP or RAP - Los Angeles Recreation and Parks Department
- Pastilla - Pasadena based design studio
- RAP+ - The nickname for Pastilla's proposal
- ShineLA - Researched System Proposal
ShineLA VS Pastilla Proposal "RAP+"
Goal:
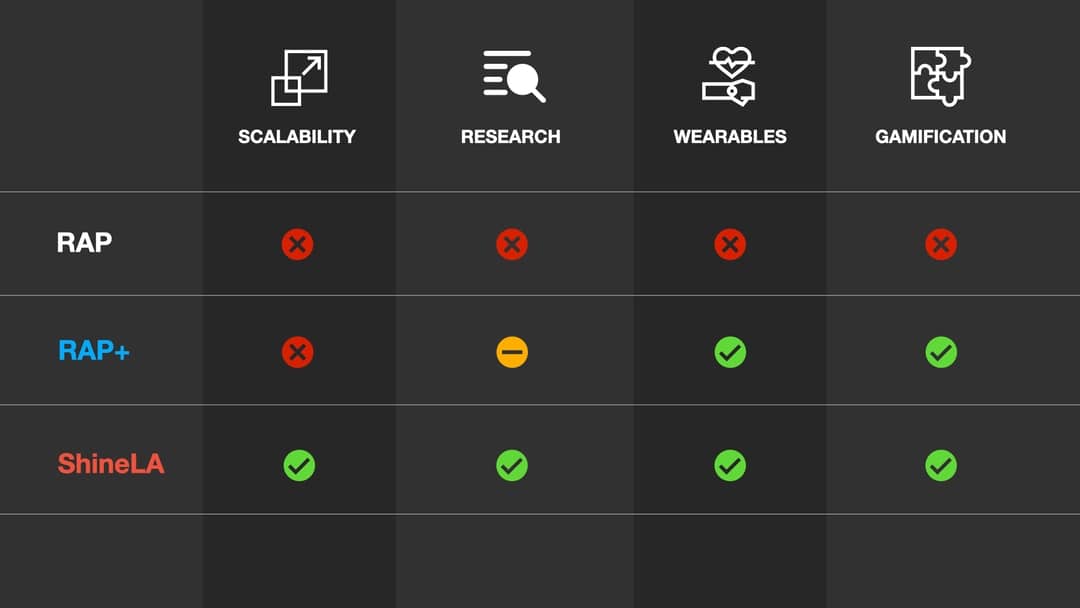
To understand the pros and cons of funding a standalone system (ShineLA) or a proposed system “integrating with RAP” within the context of a future scenario of the system being used as a national research platform to conduct population science through. This platform could enable Cedars-Sinai or small and large teams to run citizen science.
Insights:
There are many activity registration platforms, such as CivicPlus, RecDesk, ActiveNetwork, and Vermont Systems. Vermont Systems is the platform that LA RAP uses, is the least popular in Southern California.
Vermont Systems does not have an Application Protocol Interface or API which allows two separate systems talk to each other. The API is the key distinction between how the proposed RAP+ System and ShineLA operate with organizations, and institutions.) This matters because the proposed doesn’t have its own recreation system backend, it is being "coded" to work with Vermont Systems, the business implication here, while cheaper to startup, in the long run will cost much more to "integrate" with other platforms.
Because there is no API, RAP+ will literally load the activities page and scan/intercept the information from the page and write that information to the RAP+ database.
Downside 1: The database or activity “inventory” is only updated once a day, a user could pick an activity that had already been full, or canceled.
Downside 2: RAP+ will not be able to see events from other systems, organizations or institutions unless they use Vermont Systems RAP+.
Proposal:
Cedars-Sinai and other research teams log in through ShineLA and are able to access data from any partner that used ShineLA as its backend or had an API. This is made possible because it has its own backend system instead of relying on Vermont Systems. It is likely that if the project were to move forward with RAP+ that research teams have to go through LA RAP to collect information stored in it’s sillo'd Vermont Systems account.
Because this stand-alone ShineLA creates its own databases for keeping track of events Shine-LA users attend and health data points, it would be able to scale larger than RAP+.
In order to scale past Los Angeles, our recommendation is to explore development options or create a standalone system and not be tied into Vermont Systems.
Cedars-Sinai Researcher Interviews
Goal:
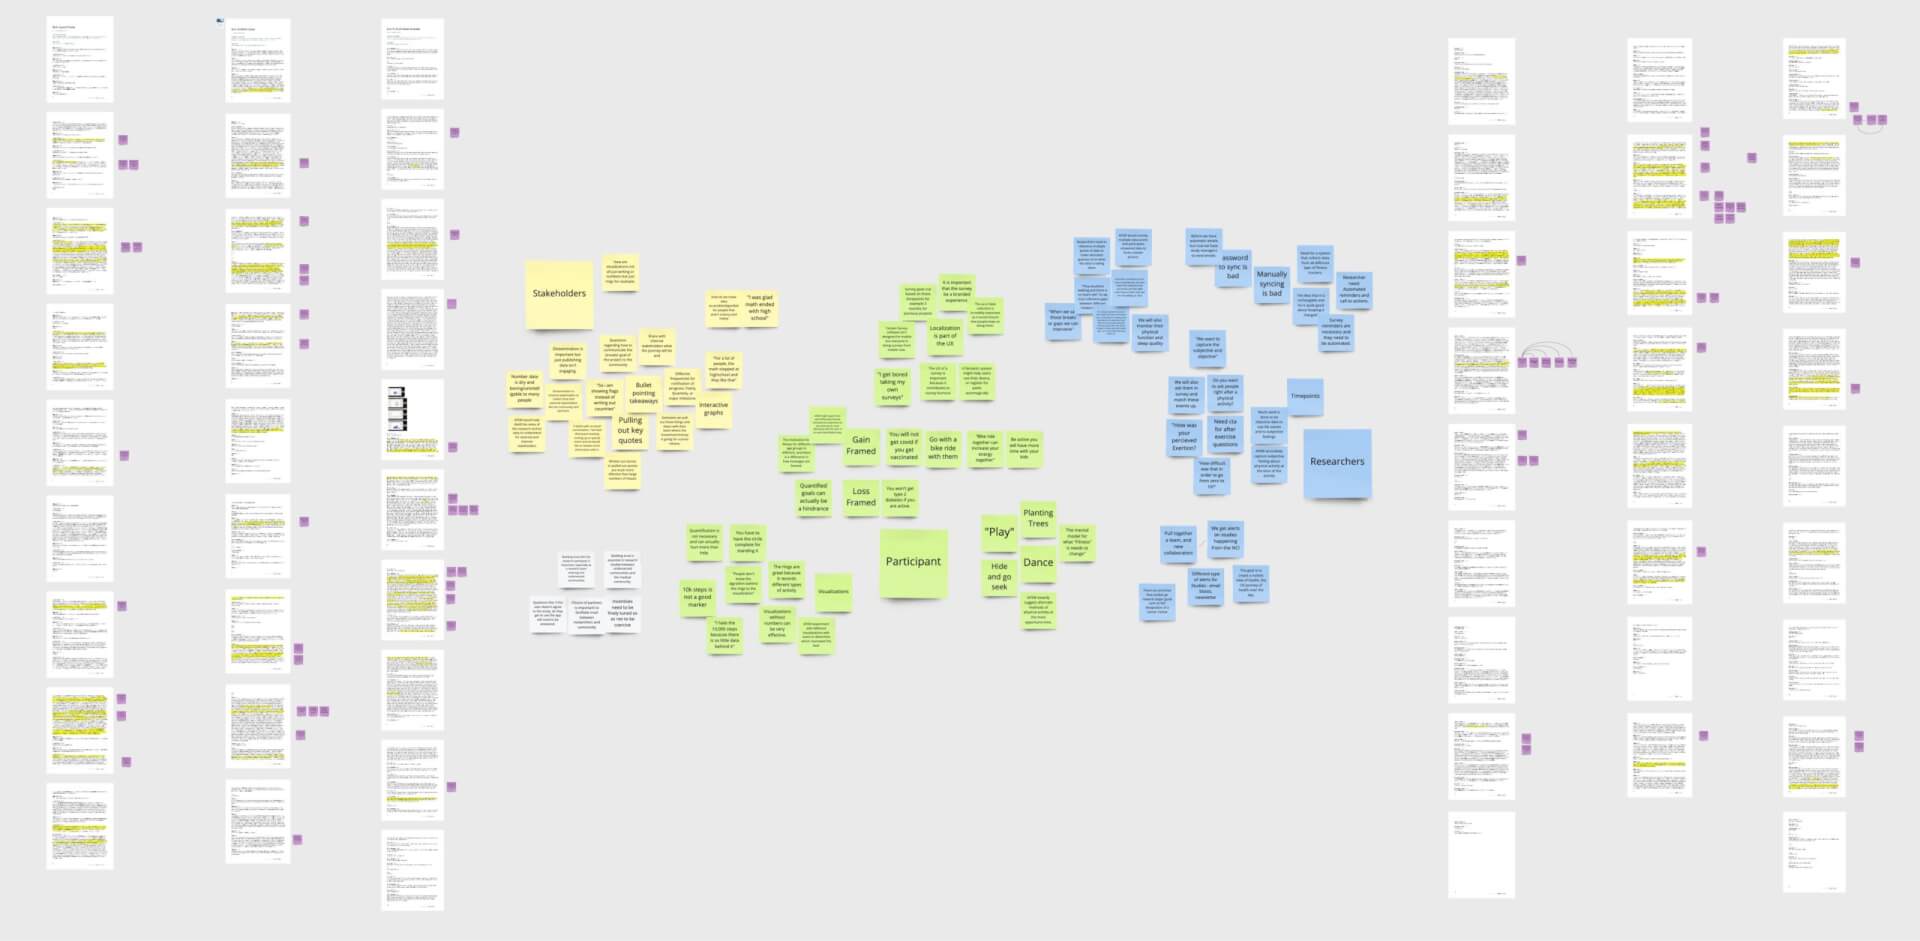
Before designing the research back-end for ShineLA we created a proto-persona, or fake user character sheet, of the researcher and created a discussion guide so that we might better understand their goals, motivations, and friction points.We coded the interviews and grouped the sentiments contextually and through analysis using the KJ method distilled the following insights:
Communication Theme
Insights:
- Cedars-Sinai Research Team has a responsibility to disseminate information to internal stakeholders at Cedars-Sinai and external stakeholders such as the community/donors/sponsors.
- Number data is dry and boring/unintelligible to many potential donors and sponsors.
- Anecdotes and personal testimonials are much more compelling in creating a connection than large numbers.
Takeaway:
From these insights, we ascertained “A fantastic system will help distill the value of the research and be easy to understand for external and internal stakeholders”.
Action: Corporate Sponsorship Research and Donor/Stakeholder Dashboard
Data Collection Theme
Insights:
A significant amount of effort to tie objective data to real-life events and to subjective feelings, this is shown through the surveys and various “Time-sync” events that researchers attempt to establish.
Researchers have to reference multiple points of data in multiple formats and scales to make educated guesses as to what the data is telling them.
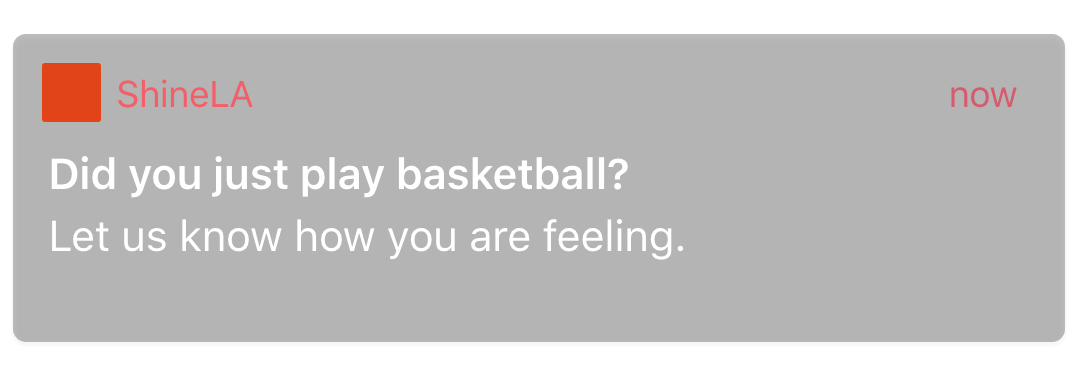
Researchers can benefit from automated reminders for participants to charge their trackers, wear them properly, remind them to synchronize their data, and need automated questions after exercise to better utilize their time.
Takeaway:
From these insights, we ascertained “A fantastic system will help distill the value of the research and be easy to understand for external and internal stakeholders”.
Action: Research Visualization Tool
Los Angelinos UX
Insights:
The UX of data collection is incredibly important as it will ensure people would keep on doing the surveys/questions.
The motivation for physical exercise changes for each age group is different, in how the messages to encourage the participants can be structured in different ways.
Quantification is not necessary and can actually hurt more than help, seeing 9,999 steps left will demotivate certain users.
The mental model for what “exercise” is, needs to change. Individuals who are not physically active, need to change their mindset to acknowledge that play, such as hide and seek for an hour, is exercise.
Takeaway:
- A fantastic system will experiment with different visualizations with research participants to determine which resonated the best.
- A fantastic system will smartly suggest alternate methods of physical activity at the most opportune time.
- A fantastic system will experiment with differently framed motivational statements to see what works most effectively with the research participants in an automated/logical way.
- Machine learning could be used to AB Test messages that are created by the Cedars-Sinai Research team or machine-generated/composed.
Action: Survey Usability Testing and Prototyping
General Takeaways
The Cedars-Sinai Researchers all shared the sentiment that the 10k step is a poor benchmark and that numbers in the progress bars of fitness trackers could be more of a hindrance for certain types of participants. It was through these discussions that we discovered the need to create four different personas for participants, (more on this in the participant section).
After this analysis and digestion of insights with the researchers we realized that the Cedars-Sinai researchers all share the sentiment that the 10k step is a poor benchmark, and the current method for collecting data, Redcap, had an unpleasant participant user experience as the interface was clunky and looked outdated. We also realized that visualizations through Fitabase were inefficient, and discovered that Cedars-Sinai Research Team has to communicate their findings to donors, sponsors, and internal groups at Cedars-Sinai.
The insight that was the most obvious but least anticipated - “Building trust is essential in research studies between underserved communities and the medical community”
Corporate Sponsorship Research
Goal:
Understand how to create corporate partnerships and how to make a pitch.
Insights:
Pitches for multi-million dollar sponsorships must be finely tailored for the sponsor.
$15M in sponsorship should equate to international level marketing.
“The goal is to prove good synergy but keep it flexible so it can meet their needs”. We delved into the word “Synergy”.
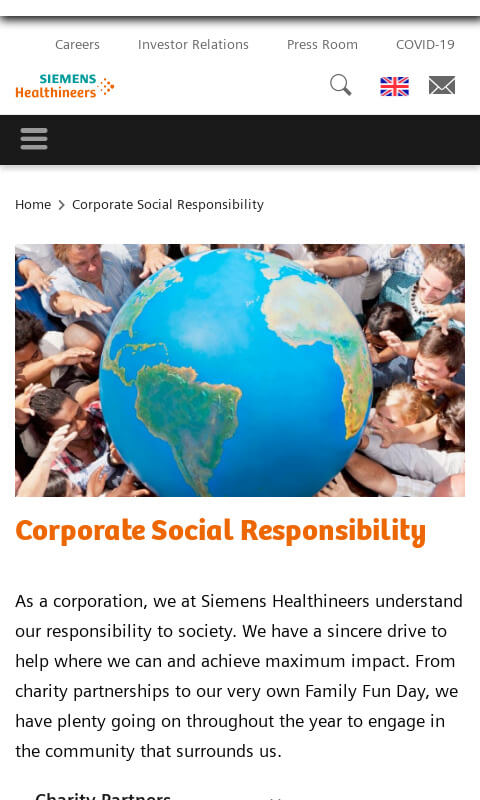
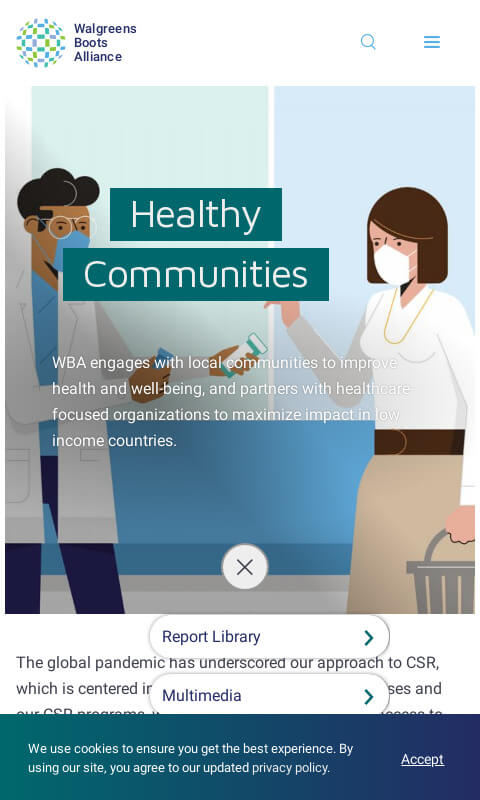
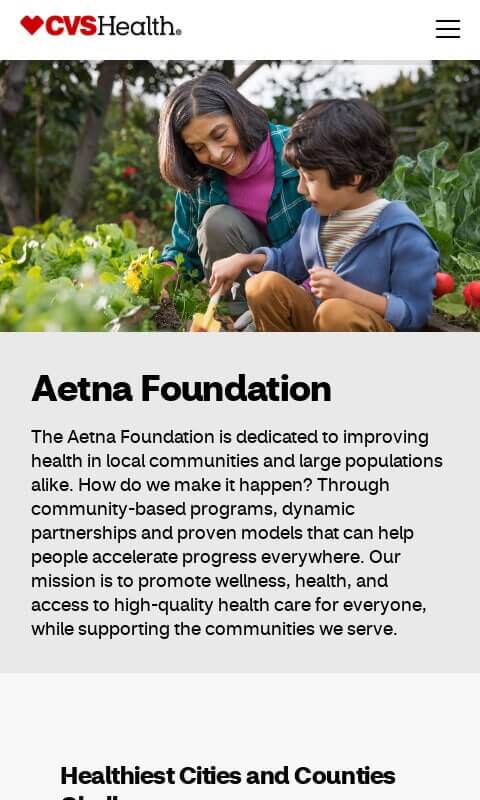
Matching Corporate Social Responsibilities of sponsors with the “Cedars-Sinai” of the ShineLA project.
Show mutual-beneficial relationship. Explain the long-term benefit.
Gain inside knowledge on “athletes secretly just-signed” - Sports teams, and sportswear companies might be looking to sponsor projects that these athletes could “be the face of”.
Proposal:
The creation of a pitch-deck would create an ally in the “target” sponsor company and show them how well Cedars-Sinai and target’s goals align at present and how a future relationship would be mutually beneficial to both organizations.
We recommend brainstorming less obvious partnerships for example, sports teams wanting to promote athletes in specific sports.
Research Visualization Tool
A speculative system that would allow researchers to combine multiple data sources in one and eliminate cross-tab switching and mode-switching scales. Create a data visualization viewer that would allow researchers to cross-examine data and add annotations.
Insights:
Cedars-Sinai Researchers have to go from tab to tab, to figure out the story behind the data. For example, when the researcher sees a gap in heart rate, they first go to the Battery tab to see if the device lost power, then they cross-reference this page with another that shows the steps for the day before they can conclude that the research participant might not have worn the device tight enough.
This process is made more difficult because these tables on different tabs are displayed at different time scales and take up valuable researcher time to try to consolidate/cross-reference.
Proposal:
Consolidates timescales into a consistent data view.
Allows researchers to annotate data.
Allows researchers to read research participant submitted data such as “Effort required to start an activity”.
Machine Learning will suggest annotations for gaps which saves the researcher time and could speed up analysis.
Survey Testing and Prototyping
Goal:
We heard from the researchers the importance of the collection of data, strict adherence to not reinterpreting data received (even in cases where the researchers were sure that it was entered in the wrong units), and a general decrease in friction for participants filling out the surveys. We did our own user tests of one of the systems used - Qualitrics; and identified some issues in terms of responsiveness. It did work for mobile, however, the research participant’s experience of navigating a long page, scrolling from drop-down menu to drop-down menu was less than ideal.
Prototype Status and Findings:
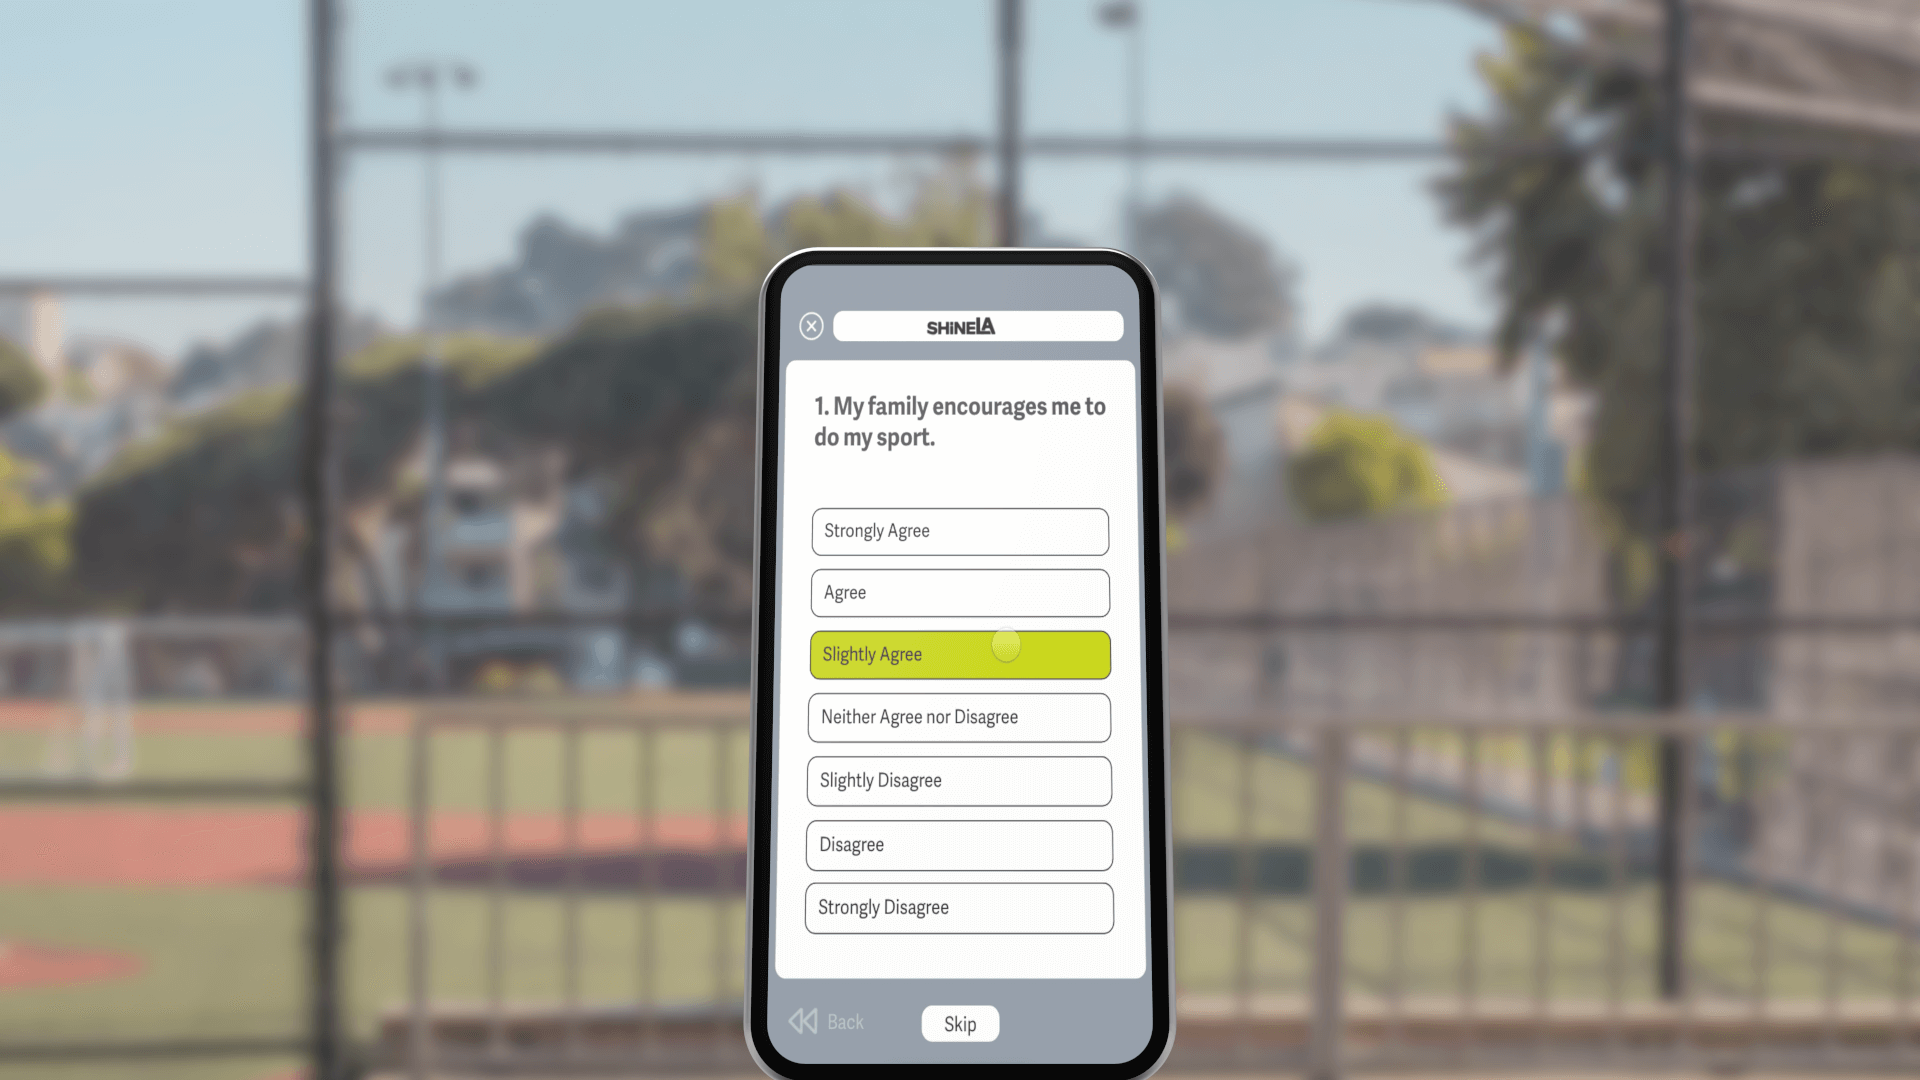
To reduce fatigue and make the survey or data collection experience more seamless we ideated on a survey prototype which would group similar questions, such as a 7 point Likert scale together into sections and remove the dropdown and display all options in the same place on the screen to lessen the cognitive load.
In an iteration, the unit was explicitly stated next to a fill-in-the-blank numeric field. Based on feedback we learned that the researchers preferred drop-down menus or hard-coded answers to reduce time to clean up the data and errors. Our next revision includes two dropdown menus. One for numbers, the other to specify units for the participants to select from. At the time of writing, we have not gotten feedback from the researchers but testing shows that users are able to use the affordances designed.
Next Steps
Over the course of 9 months we did a lot of research, at the end of our final presentation we showed this list of actionable items. I had ordered them based on MVP objectives.
- Get a second quote on Shine-LA development cost from a different company
- Corporate Sponsorship: Brainstorm synergies and research corporate social responsibilities of potential partners
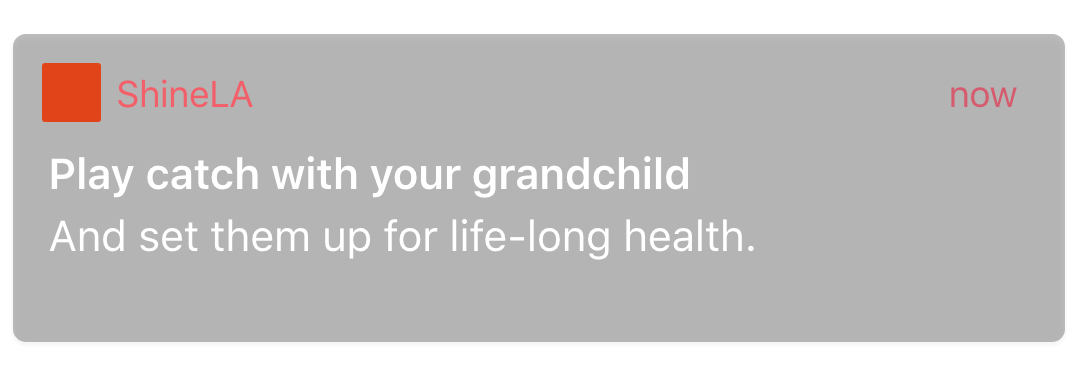
- Create survey platform with user profiles and push notification data collection
- Research wearable options with research participant user group
- Create SOL reward System and excercise activity feed
- Fitbit/Garmin/Other integration and create researcher single timeline data visualization dashboard
- Create donor/sponsor/stakeholder dashboard and discovery page
Project Takeaways:
I didn't know when I started how much experience I would be getting researching multi-stakeholder, multi-user-persona systems.
- As a result of research, multiple times during presentation we were told "we just started looking into this, this week".
- I gained experience carrying on a "legacy" project and documenting it for future teams.
© Dillon Chi 2024
